Quick Start
Welcome to Dgraph! This guide will get you up and running in minutes. You'll learn how to start Dgraph, load sample data, and run your first queries.
Prerequisites
- Docker installed and running
- A terminal window
- About 5 minutes
Step 1: Create Quickstart Working Directory
Create a directory to work from while following the guide, and open a terminal session in that directory.
For example:
mkdir ~/Desktop/dgraph-quickstart
cd ~/Desktop/dgraph-quickstart
``
## Step 2: Start Dgraph

From the directory you created, run Dgraph using the official Docker image:

```bash
docker run --detach --name dgraph-play \
  -v $(pwd):/dgraph \
  -p "8080:8080" \
  -p "9080:9080" \
  --pull always dgraph/standalone:latest
This command:
- Starts Dgraph in the background (
--detach) - Names the container
dgraph-playfor easy management - Mounts your current directory to
/dgraphin the container - Exposes ports 8080 (HTTP) and 9080 (gRPC)
Verify it's running:
curl http://localhost:8080/health | jq '.[0].status'
Or, if jq is not installed on your system:
(curl http://localhost:8080/health 2>/dev/null | grep -q '"status":"healthy"' && echo "healthy") || echo "NOT healthy"
Either will output healthy if everything is OK.
Step 3: Download Sample Data
Download the sample dataset (movie data) to the working directory you created:
curl -LO https://github.com/dgraph-io/dgraph-benchmarks/raw/refs/heads/main/data/1million.rdf.gz
curl -LO https://raw.githubusercontent.com/dgraph-io/dgraph-benchmarks/refs/heads/main/data/1million.schema
Step 4: Load Sample Data
Load the data into Dgraph:
docker exec -it dgraph-play dgraph live \
  -f 1million.rdf.gz \
  -s 1million.schema
This loads over 1 million movie-related facts into your database. The process takes about 15-30 seconds.
Step 5: Open Ratel UI
Ratel is Dgraph's visual query interface. Start it with:
docker run --rm -it -p 8000:8000 dgraph/ratel:latest
And then navigate to http://localhost:8000 in your browser.
Ratel should start already configured to connect to your local Dgraph instance.
You can confirm by verifying that the text underneath the 'lightning' connection button at the top of left side toolbar shows "http://localhost:8080".
If it does not:
- Click on the connection icon.
- Enter
http://localhost:8080as the Dgraph connection string - Click Connect
You're now connected! Click Continue to access the console.
Step 4: Run Your First Query
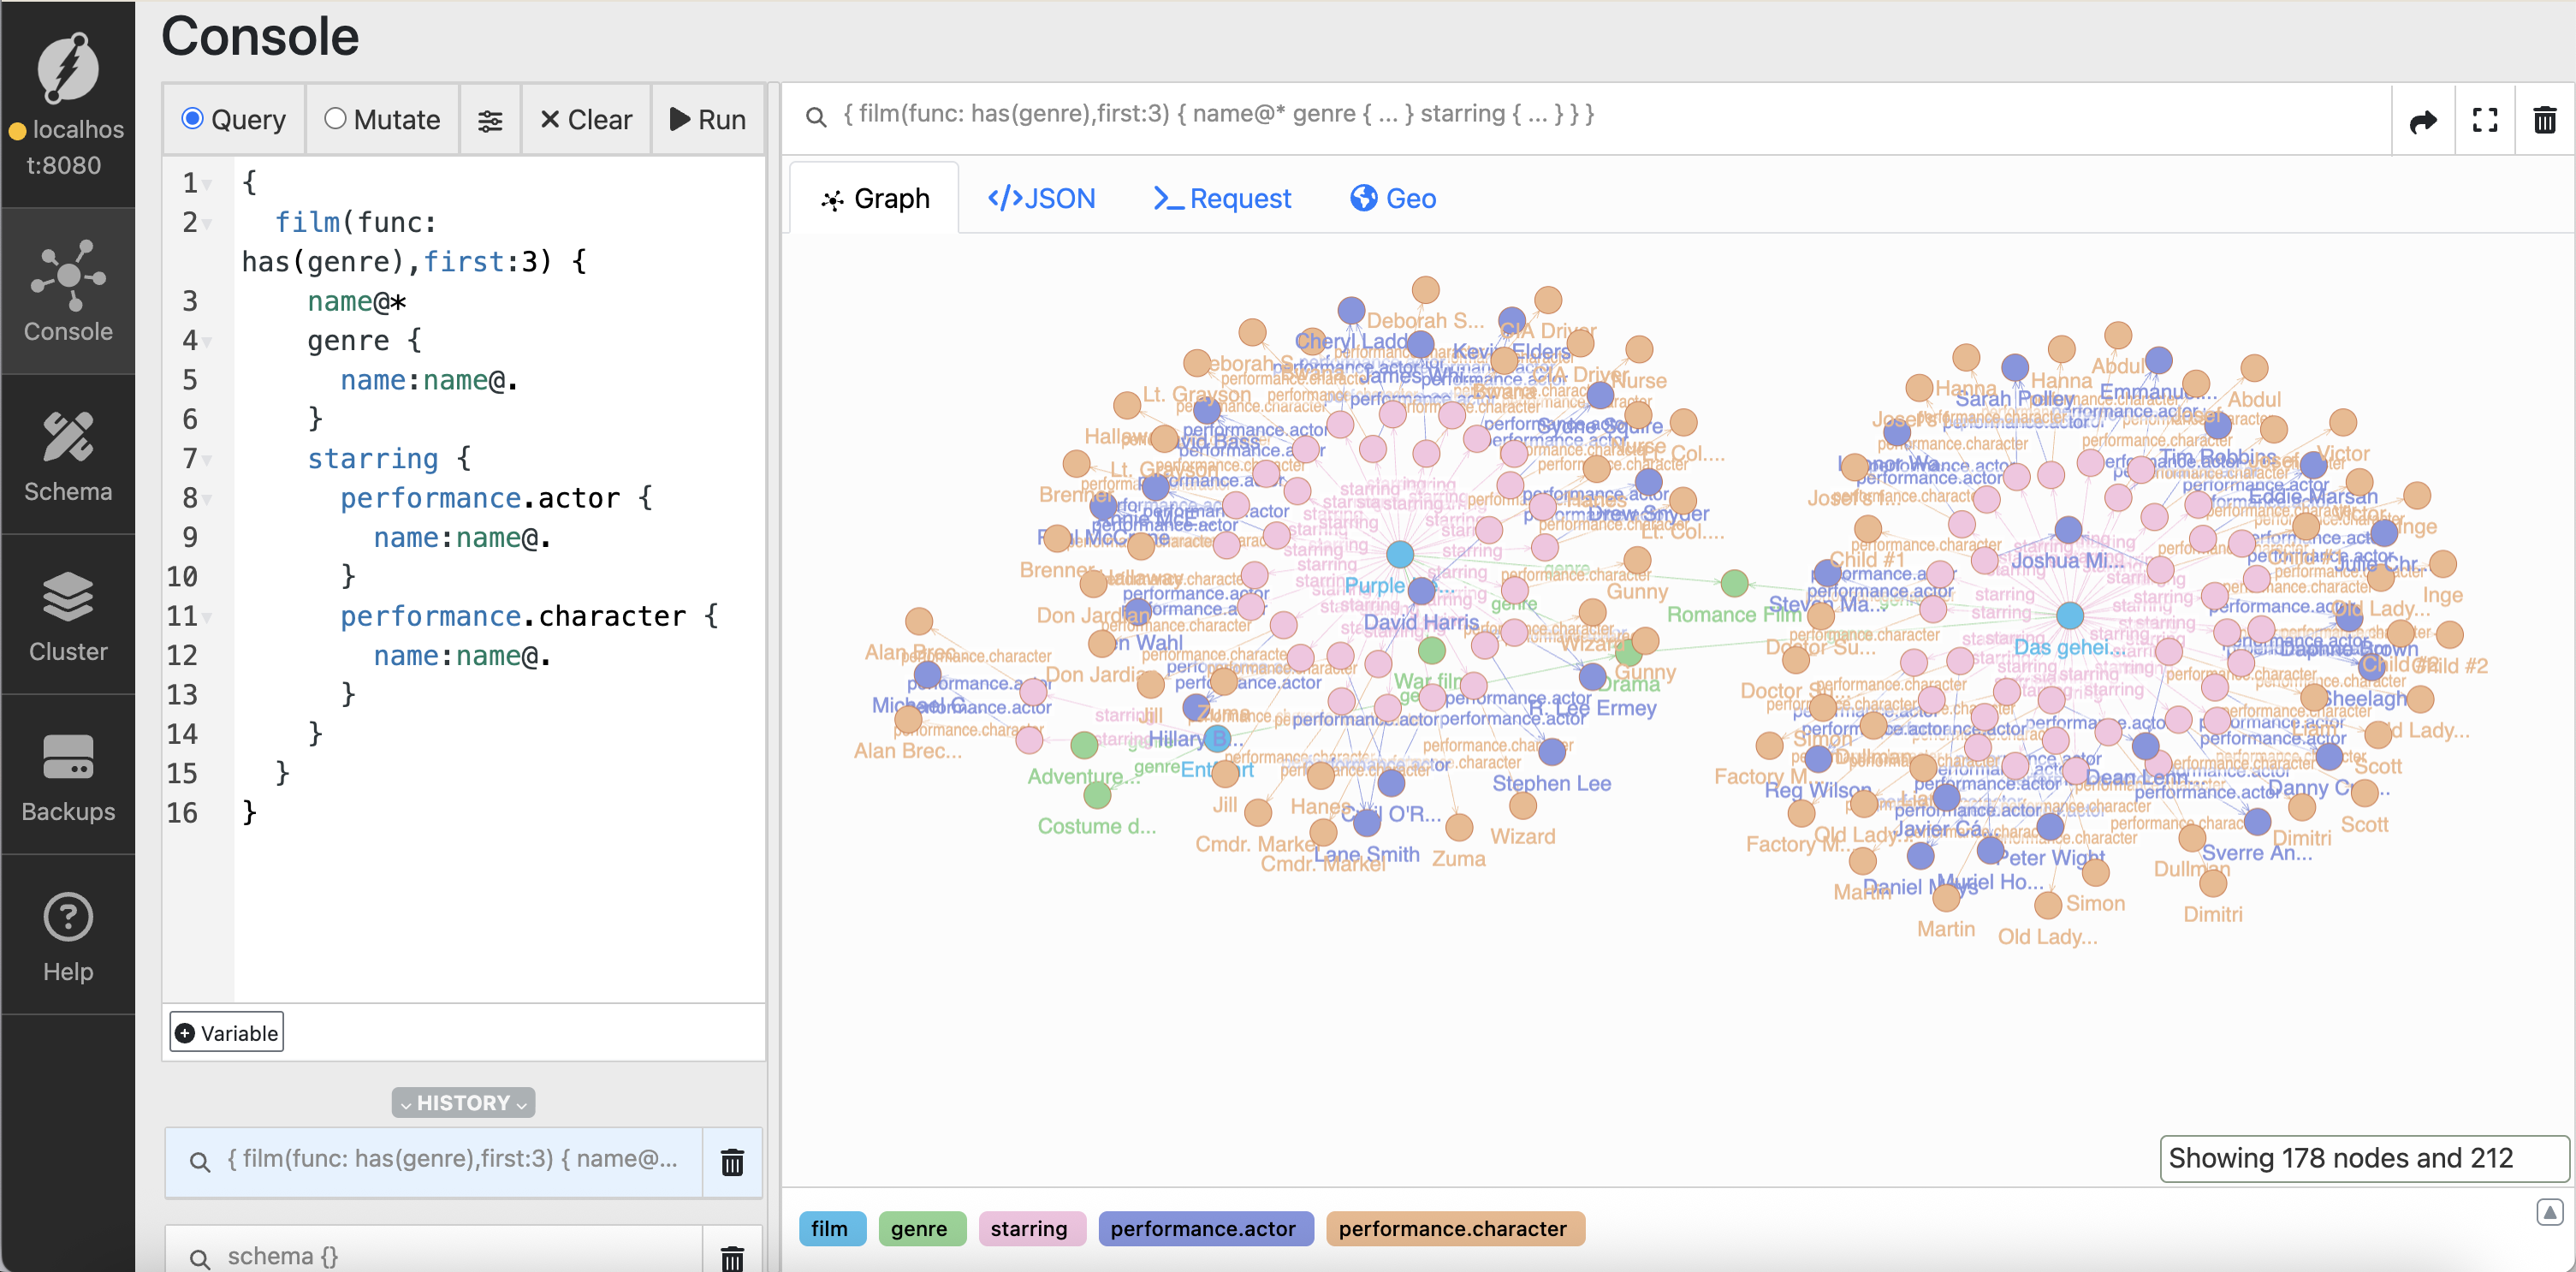
In Ratel's Query tab, paste this DQL query:
{
  film(func: has(genre), first: 3) {
    name@*
    genre {
      name: name@.
    }
    starring {
      performance.actor {
        name: name@.
      }
      performance.character {
        name: name@.
      }
    }
  }
}

Click Run to execute the query. This finds movies with genres and displays their details, including actors and characters.
What this query does:
- Finds nodes that have a
genrepredicate - Returns the first 3 results
- Retrieves movie names, genres, and starring information
Step 5: Explore the Results
View your results in two ways:
- JSON tab - See the raw data structure
- Graph tab - Visualize the relationships
Switch to the Graph tab to see how movies, genres, actors, and characters are connected.
What's Next?
Congratulations! You've successfully:
- ✅ Started a Dgraph instance
- ✅ Loaded real-world data
- ✅ Run your first graph query
- ✅ Explored results visually
Continue learning:
- DQL Query Guide - Master Dgraph's query language
- Clients - Connect from your application
- Installation Guide - Production deployment options